Inflation rates in Zimbabwe
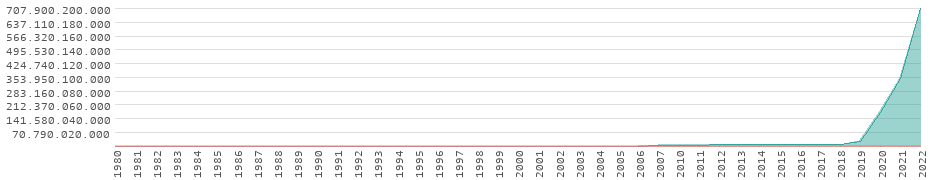
The inflation rate for consumer prices in Zimbabwe moved over the past 42 years between -2.4% and 24,411.0%. For 2022, an inflation rate of 104.7% was calculated.During the observation period from 1980 to 2022, the average inflation rate was 672.5% per year. Overall, the price increase was 707.90 billion percent. An item that cost 100 dollars in 1980 costs 707.90 billion dollars at the beginning of 2023.
› Inflation rates in global comparison
Performance over the last 42 years compared with the USA
In only a few countries are negative inflation rates achieved. This means that the general price level is declining and consumer prices get cheaper. This is called deflation. In comparison to most other countries, the drastic price increases are no longer average. Usually this is a sign of political and economic turmoil.Performance based on 100% in 1979:
Inflation calculator for Zimbabwe
Enter any amount, a start year and an end year here. You will then be shown the amount that resulted from the original amount after inflation.100 dollars in 1980 will still be 100 dollars in 2023. The nominal value does not change. What does change, is the purchasing power. In other words, the amount of goods that can be bought with this money. As inflation increases, this amount decreases.
Example: The purchasing power of 100 dollars in 1980 corresponds to that of 707,900,183,149.37 dollars at the beginning of 2023. Conversely, in 1980 you could buy as much with -34.93 dollars as you can today with 1000 dollars.
Inflation rates for consumer goods in Zimbabwe
Historical inflation rates in comparison
| Year | Zimbabwe | Ø EU | Ø USA | Ø World |
|---|---|---|---|---|
| 2022 | 104.71 % | 8.83 % | 8.00 % | 7.97 % |
| 2021 | 98.55 % | 2.55 % | 4.70 % | 3.47 % |
| 2020 | 557.20 % | 0.48 % | 1.23 % | 1.94 % |
| 2019 | 255.30 % | 1.63 % | 1.81 % | 2.21 % |
| 2018 | 10.62 % | 1.74 % | 2.44 % | 2.44 % |
| 2017 | 0.89 % | 1.43 % | 2.13 % | 2.22 % |
| 2016 | -1.54 % | 0.18 % | 1.26 % | 1.61 % |
| 2015 | -2.43 % | -0.06 % | 0.12 % | 1.44 % |
| 2014 | -0.20 % | 0.20 % | 1.62 % | 2.35 % |
| 2013 | 1.63 % | 1.22 % | 1.46 % | 2.62 % |
| 2012 | 3.73 % | 2.66 % | 2.07 % | 3.73 % |
| 2011 | 3.47 % | 3.29 % | 3.16 % | 4.82 % |
| 2010 | 3.02 % | 1.53 % | 1.64 % | 3.35 % |
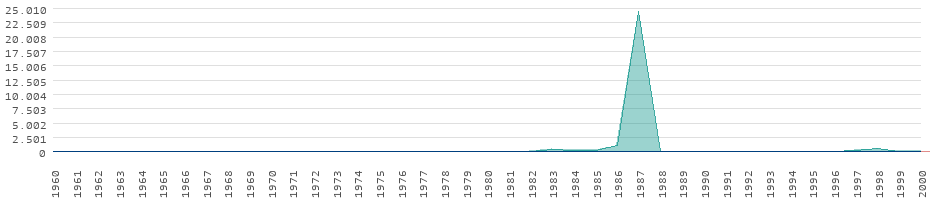
| 2007 | 24,411.03 % | 2.51 % | 2.85 % | 4.82 % |
| 2006 | 1,096.68 % | 2.67 % | 3.23 % | 4.28 % |
| 2005 | 302.12 % | 2.49 % | 3.39 % | 4.11 % |
| 2004 | 282.38 % | 2.29 % | 2.68 % | 3.38 % |
| 2003 | 431.70 % | 2.09 % | 2.27 % | 3.03 % |
| 2002 | 140.06 % | 2.42 % | 1.59 % | 2.83 % |
| 2001 | 76.71 % | 3.37 % | 2.83 % | 3.84 % |
| 2000 | 55.87 % | 3.15 % | 3.38 % | 3.49 % |
| 1999 | 58.52 % | 2.16 % | 2.19 % | 3.08 % |
| 1998 | 31.82 % | 2.42 % | 1.55 % | 5.11 % |
| 1997 | 18.74 % | 3.11 % | 2.34 % | 5.57 % |
| 1996 | 21.43 % | 3.56 % | 2.93 % | 6.55 % |
| 1995 | 22.59 % | 4.43 % | 2.81 % | 9.15 % |
| 1994 | 22.26 % | 4.72 % | 2.61 % | 10.32 % |
| 1993 | 27.59 % | 4.85 % | 2.95 % | 7.51 % |
| 1992 | 42.06 % | 6.22 % | 3.03 % | 7.71 % |
| 1991 | 23.34 % | 5.48 % | 4.23 % | 9.00 % |
| 1990 | 17.36 % | 6.15 % | 5.40 % | 8.13 % |
| 1989 | 12.88 % | 6.26 % | 4.83 % | 7.00 % |
| 1988 | 7.42 % | 4.54 % | 4.08 % | 7.15 % |
| 1987 | 12.47 % | 4.02 % | 3.66 % | 5.76 % |
| 1986 | 14.33 % | 3.68 % | 1.90 % | 5.82 % |
| 1985 | 8.49 % | 5.40 % | 3.55 % | 6.86 % |
| 1984 | 20.15 % | 7.67 % | 4.30 % | 8.12 % |
| 1983 | 23.12 % | 8.67 % | 3.21 % | 8.77 % |
| 1982 | 10.63 % | 9.58 % | 6.13 % | 10.24 % |
| 1981 | 13.15 % | 11.77 % | 10.33 % | 12.47 % |
| 1980 | 5.40 % | 12.91 % | 13.55 % | 13.98 % |
Data basis: International Monetary Fund, World Bank and OECD Inflation CPI indicator (doi:10.1787/eee82e6e-en)
 The 50 largest economies in the world
 Nepal: country data and statistics
 Global warming by continents