Business Intelligence (BI) is sourcing, blending and visualizing proprietary data to identify data trends and patterns that help enterprises define and improve their business strategy. BI tools pull data in its myriad forms – unstructured, semi-structured and structured – from many sources, and then cleanse, prepare and transform it for easy visual analysis.
With all the options available on the market, it can be overwhelming to decide on a BI tool that would be a good fit for your setup. This article offers a features-to-features comparison of two leading BI solutions, Pentaho vs Tableau.
Compare Pentaho and Tableau Against Your Needs

Overview
Before we head into a detailed feature comparison for these two tools, let’s take a quick look at their features.
Pentaho
Pentaho is a cloud-based data integration tool and business analytics platform. Its data integration engine, PDI, pulls big data from numerous databases, including Hadoop, NoSQL, MongoDB and many more. It then cleanses, prepares and transforms it for interactive visualization and analysis.
Embeddable into business applications, Pentaho enables users to filter and zoom in on specific data to view and share through dashboards and reports. ML-powered data modeling enables easy forecasting through data scoring and scenario analysis. In addition to Kettle, its ETL component, the vendor offers other open-source projects like Pentaho Data Mining and Mondrian.
Tableau
Tableau pulls disparate data from hundreds of sources like Amazon Redshift, SQL Server, Dropbox, Google Sheets and more. Its flagship version, Tableau Desktop, provides reporting functionality to businesses as part of the Tableau Creator package.
Tableau Public provides a free public gallery of visualizations contributed by its user community. Through integrations with R and Python, it enables statistical analytics to forecast future data trends. Intuitive features like Ask Data and Show Me provide self-service analytics at users’ fingertips.
For more information on these tools’ key differentiators and support options, head over to our product pages, linked above, or request our free pricing guide.

Head-to-Head Comparison
Dashboards and Data Visualization
With businesses wanting quicker insight to action, it is crucial that decision-making stakeholders, irrespective of technical skills, make sense of proprietary data in real time. They can do so through data visualizations such as dashboards, charts, graphs and plots, which display relevant data in an easy-on-the-eyes format.
Pentaho’s Dashboard Designer helps create interactive visualizations and dashboards with a 360-degree view of data through dynamic filter controls and content linking. Lasso filtering, drag-and-drop, attribute highlighting, and zoom-in capabilities make it easy to isolate key trends, details and patterns. It helps integrate business analytics with other applications through portal and mashup integrations.

A sunburst visualization in Pentaho.
Tableau’s dashboards are interactive and easily embeddable on the web, with drill-down, highlight and filter capabilities. It supports choropleth maps, point distribution maps, flow maps, heat maps and more. Using custom geocodes, Tableau can convert location data into stunning visualizations. Its Dashboard Starters help visualize data faster from applications like Linkedin Navigator, Marketo and Salesforce. Its Device Designer allows users to create and preview dashboards for viewing on desktops, tablets, and smartphones.

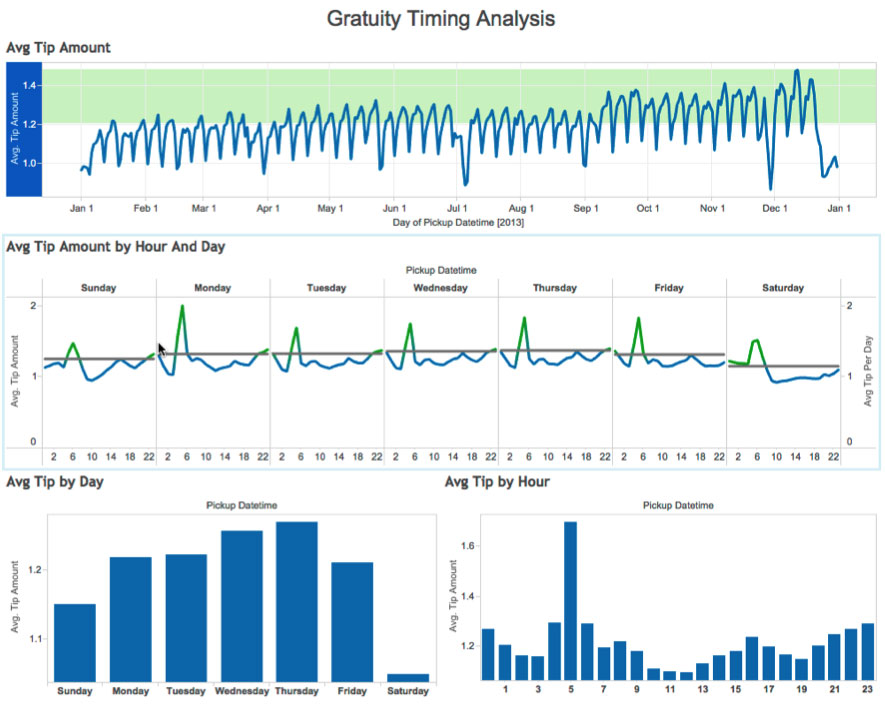
A data visualization in Tableau.
Winner: Our analysts rated Tableau as the winner for this feature. Tableau is renowned for its wide range of interactive and dynamic visualizations, including dashboards. Intuitive features like geospatial mapping and pre-built dashboard templates make it a popular choice.
Reporting
Reporting allows sharing of data insights with others, especially with end report consumers who might not have direct access to dashboards or analytic tools.
Pentaho’s Report Designer helps create print-ready, interactive reports through easy drag and drop, font selection, and formatting and resizing elements. Users can share reports in HTML, PDF, Excel or CSV format through email. Report data is kept secure with role-based content permissions and features like locking and permission expirations.

Pentaho Report Designer.
With Tableau’s BI tool, users can build ad-hoc or managed reports which can be published and accessed through the browser, depending on access permissions. It provides scheduled sharing of reports via email as images or PDFs for regular data insights. Users wishing to view reports can subscribe to receive them via email.
Winner: Our analysts rated both Pentaho and Tableau equally in regards to reporting. Both tools provide easy report creation and sharing, with role-based access permissions to maintain data integrity.
Data Source Connectivity
Enterprises need to source proprietary data from files, live data, web content, data lakes, data warehouses and many more databases.
Pentaho Data Integration (PDI), formerly known as KETTLE, connects to more than 40 data sources including JDBC, MongoDB, OLAP data sources and SQL databases. It can import data from any file type but connects to only two SaaS platforms – Google Analytics and Salesforce. Its Data Source Wizard allows users to add custom data sources and define them for the Pentaho Server. The Wizard also walks users through the creation of their first relational or multidimensional data model.
Tableau has built-in connectors for Google Analytics, Cloudera, Amazon Redshift, Microsoft Excel, Dropbox and more. Developers can create custom connections to sources and easily switch from live data connections to stored databases. Users can live query against on-premises data and schedule extracts, refreshes and queries in real time with Tableau Bridge.

Data Sources in Tableau.
Winner: Our analysts rated Tableau as the winner in this category because of its wide-ranging data integration capabilities.
Embedded Analytics
Embeddability takes analytics to where users are. An embedded BI tool should have white-labeling capabilities to blend in with enterprise software without compromising data management, visualization and reporting. In addition, it should have built-in security features like versioning and access permissions.
Based on an open REST-based API, Pentaho supports multi-tenant deployment for reduced complexity and cost. It offers numerous options to embed real-time reports and tailored dashboards into applications and web pages. The platform has a theme engine to customize the style of reports through CSS and other methods.
Tableau’s embedded analytics empowers users to visualize their proprietary data and analyze it to glean actionable insights. With intuitive security features like single sign-on, end users can get data-based insights without leaving their applications. Dashboards created once can be accessed later, with role-based access permissions and row-level security. The vendor provides sample code for mobile app development with embedded Tableau functionality.
Winner: Our analysts rated Tableau as the winner in this category. It is easily embeddable and extensible to mobile, putting it ahead of Pentaho.
Big Data Analytics
Big data analytics tools help uncover data trends and patterns, associations and other useful insights in proprietary data. They have all the functionality of a BI tool, and then some. Besides the descriptive and diagnostic analytics capabilities of BI tools, big data analytics tools provide predictive and prescriptive analysis for forecasting and future planning. In addition, these tools should enable self-service analytics for faster insight to action.
Pentaho supports Hadoop and Spark for big data analytics, from data aggregation to preparation to visualization to analysis to prediction. It integrates with object stores, NoSQL stores and analytics databases, log files, and JSON/XML formats. It speeds up data transformation through metadata injection, automating an otherwise time-consuming task.
Tableau connects to on-premises and cloud data warehouses, Hadoop and NoSQL platforms like MongoDB, Datastax and Marklogic. Its proprietary technology, VizQL, enables visual analysis, doing away with the need for tedious row-and-column organization and charting. With native connectivity to data processing platforms like Spark, it allows users to visualize the results of complex machine learning models from platforms such as Databricks. Tableau’s analytics extensions are now available in Tableau Online, with support for Python and R. This enables users to leverage advanced analysis capabilities that are not available out-of-the-box, like scenario analysis.
Winner: Our analysts rated Pentaho ahead of Tableau for this feature. Data mining and data integration are open-source in Pentaho, making it a frontrunner in big data analytics, and its faster data transformation workflows are an added plus.
Predictive Analytics
Predictive analytics helps businesses position themselves better by surfacing previously undiscovered opportunities and identifying anomalies and gaps. BI tools with predictive analytics capabilities help analyze historical and current data to forecast data trends and patterns.
Pentaho’s machine learning algorithms enable data preprocessing, classification, association and visualization based on predictive modeling. Its data-mining plugin, Weka, supports time series analysis and data modeling. The classification and clustering models created with Weka can be used to score new incoming data for predictions.

Weka Explorer in Pentaho.
Tableau comes with out-of-the-box predictive analytics capabilities, with modeling technologies that include trending and forecasting. It provides cluster, segmentation and cohort analysis through easy drag-and-drop, though it does not support Predictive Modeling Markup Language (PMML) and text mining.
Time-Series Analysis in Tableau.
Tableau provides time-series analysis and forecasting through its built-in time and date functions to analyze time trends like year-to-year performance trends.
Winner: Our analysts rated Tableau as the overall winner for this category. It enables statistical analysis with builtin predictive analytics functionality through integration with R, Python, and MATLAB via a set of SCRIPT functions. Additionally, users can perform what-if analysis for forecasting and future planning.
Compare Pentaho and Tableau Against Your Needs
Natural Language Processing
The best BI tools on the market today offer natural language processing (NLP) which makes business data accessible to all. With the power of AI, NLP helps promote shared ownership of project goals and frees up valuable IT resources.
Though Pentaho uses deep learning technologies through Spark Llib, Weka, Tensorflow and Keras, it does not provide NLP capabilities.
Tableau’s Ask Data supports text-based searches, allowing users to type a question in conversational language and get answers instantly in the form of automatic data visualizations. Users can add synonyms, calculations and definitions to customize the underlying semantic model according to their business needs. Collaborating on data insights is easy through shared dashboard links or by embedding into web pages. It supports English, French, German, Italian, Spanish, Brazilian Portuguese, Japanese, Korean, Traditional Chinese, and Simplified Chinese.

Ask Data in Tableau.
Winner: Our analysts rated Tableau as the winner in this category. Its ML-based, iterative natural language searches can be used for geocoding, an added plus.
Augmented Analytics
Besides natural language processing, augmented analytics features like automated suggestions and contextual insights help democratize data across the organization. AutoML – automated feature selection for data modeling and automatic algorithm selection – takes it a step further, enabling easy forecasting.
Pentaho does not provide augmented analytics.
Tableau’s Show Me suggests visualization types based on the data under analysis. Users can apply any view – line chart, scatter plot, pie chart – to the existing data without needing to write any custom code. Data Interpreter, its data cleanup tool, removes merged cells, titles, footnotes and blank rows to make formatting easier.
Users can group and match data quicker through fuzzy matching and clustering, reducing manual work. Through Explain Data, users can get easy explanations for values by selecting them. Tableau does not support automated forecast generation and anomaly alerting.

Explain Data in Tableau.
Winner: Our analysts rated Tableau as the overall winner for augmented analytics. Fuzzy matching, clustering and Explain Data make it an excellent choice.
Compare Pentaho and Tableau Against Your Needs
IoT Analytics
Internet of Things (IoT) analytics is made possible by blending big data with streaming analytics in real time. When empowered by AI, big data collected from streaming devices, such as connected machines and sensors, can help reduce operating costs, optimize usage models and identify data gaps.
Pentaho collects data from log files, social media, financial data, telemetry, IoT systems and more. It ingests machine and sensor data through Message Queuing Telemetry Transport (MQTT) and Advanced Message Queuing (AMQP) protocols. As part of data integration, it operationalizes Python, R, Scala or Weka machine learning models, including those that use scikit-learn, Tensorflow and Keras libraries.
Tableau pulls data from a multitude of IoT-connected devices such as sensors on manufacturing equipment, pipelines, weather stations, delivery and chatbots for self-service exploration and analysis. In collaboration with partner integrations, it helps analyze data in real time as it is generated.

IoT-powered Data Analytics in Tableau.
Winner: Our analysts rated Pentaho as the winner in this category. It speeds up visualization and reporting with metadata injection and a streamlined data refining system. Powered by machine learning and embedded analytics, it allows insights to be delivered directly to IoT applications and services.
Database Security
Data security and governance are vital to driving the adoption of analytics across the organization. Analytics tools provide varying options for data governance, ranging from row to column-level security for access to only pertinent information, to comprehensive audit trails and data lineage.
Pentaho provides big data security through Kerberos authentication and secure impersonation for connecting to a server cluster. Account Administrators can manage access to files and folders via the Pentaho User Console. Through the Metadata Editor, they can grant and revoke table, row, column and object-level access to data. In addition to supporting multi-tenant deployment with single sign-on and security integrations, it provides report data integrity with content permissions, locking and access expirations.

Data Security in Pentaho.
With easy scalability to existing data security models, Tableau allows database security with authentication protocols, within the Tableau platform with permissions, or via a hybrid approach. Data security is enforced on published views, on mobile devices or through Tableau Desktop and Tableau Prep Builder. Data stored on the Tableau server is secured through the encryption-at-rest feature.
Tableau supports only row-level security (RLS) but does not secure data at the column level. All workbooks connected to live data sources are automatically updated to show the latest data as it is refreshed.
Winner: Our analysts rated Pentaho as the better tool overall for this category. It is flexible and offers users the choice of two authentication methods. Additionally, features like Pentaho’s security make it a winner.
Open-Source
Open-source projects are quite popular because of the low cost of entry and transparency of the underlying code. Users can easily modify and customize the source code as per business requirements, with robust support from online user communities.
Pentaho offers an extensive palette of open-source projects. Pentaho Data Mining is a suite of open-source tools based on the Weka project. Pentaho Kettle, also known as Pentaho Data Integration (PDI), performs extract, transform and load (ETL) processes on proprietary data. Mondrian is an OLAP server that enables interactive data analysis in real-time through multidimensional queries. Pentaho Reporting provides BI and reporting capabilities like its metadata editor, report designer, user console and ad-hoc reporting interface.
Tableau offers a free community edition called Tableau Public that enables creating, sharing and viewing data visualizations on the web. These visualizations can be downloaded and used as templates; report authors have the option to disable the download of the underlying data if they want to keep it private.
Winner: Its various open-source projects make Pentaho the winner in this category.
Compare Pentaho and Tableau Against Your Needs
Native Mobile Apps
Checking in on business data when necessary is vital to proactive and timely decision-making. Users need to stay connected to their data, even when on the move and when offline. Many BI tools empower users to do just that through their native mobile apps or responsive dashboards and reports accessible via mobile browsers.
Pentaho does not offer mobile support.
Tableau Server and Tableau Online users can view metrics on their phone with a simple touch through Tableau Mobile with mobile-optimized dashboard layouts and intuitive drill-down capabilities. Deployable organization-wide while keeping all data secure, the mobile app is supported by a wide range of authentication methods, including SAML, OpenID Connect, Mutual SSL, VPN, reverse proxy and more.

Tableau Mobile BI.
Winner: As per our analysts, Tableau wins this round hands-down. It is available on mobile as a standalone app and embeddable within mobile business apps.
Free Trial
When looking at various options for a BI tool, it’s a good idea to take them for a test run. A free trial will help you gauge if the tool will integrate well with your current technologies; however, do keep in mind that free versions often do not offer all the features.
The Pentaho Business Analytics suite is available for an introductory 30-day free trial. The icing on the cake is its extensibility with various open-source projects.
Tableau is available for a 14-day free trial. Tableau Public is free to use and can be deployed with Tableau Server on-premises or on public cloud, or as a SaaS version with Tableau Online. Its flagship version, Tableau Desktop, is available as part of the Tableau Creator package.
Winner: With a 30-day free trial to try out its various features, Pentaho takes this one.
Compare Pentaho and Tableau Against Your Needs
Conclusion
With Tableau ranking ahead of Pentaho in nine out of the 13 features, our analysts have declared Tableau as the winner. It leads on features such as dashboards and data visualizations, data sources, embedded analytics, augmented analytics, natural language processing, predictive analytics and native mobile applications.
Both products tie for reporting capabilities, while Pentaho scores ahead of Tableau for big data analytics, IoT analytics, database security, open-source projects and its free trial.
Our comparison will hopefully familiarize you with the salient features of these two tools. It should also give a fair idea of what to look for in a BI tool. To know more about the pricing plans for these products, check out our free pricing guide. It includes information on all top-rated BI software with a detailed description of pricing plans and tech specs.
Of course, there is no one-size-fits-all solution here. Do keep in mind the specific requirements of your business when considering which tool to buy.
Did we miss something in our Pentaho vs Tableau comparison? Which one is the winner for you? Be sure to let us know in the comments below!
Top Competitors


