
Energy Efficiency and Performance Evaluation of an Exterior-Rotor Brushless DC Motor and Drive System across the Full Operating Range

1
K. Lisa Yang Center for Bionics, Massachusetts Institute of Technology, Cambridge, MA 02142, USA
2
Department of Media Arts and Sciences, Massachusetts Institute of Technology, Cambridge, MA 02142, USA
*
Author to whom correspondence should be addressed.
Actuators 2023, 12(8), 318; https://doi.org/10.3390/act12080318
Submission received: 1 July 2023
/
Revised: 3 August 2023
/
Accepted: 4 August 2023
/
Published: 6 August 2023
(This article belongs to the Section Actuators for Robotics)
Abstract
:In recent years, exterior-rotor brushless DC motors have become increasingly popular in robotics applications due to their compact shape and high torque density. However, these motors were originally used for continuous operation in drones. For applications such as exoskeletons, prostheses, or legged robots, short bursts of high power are often required. Unfortunately, vendors do not typically provide data on the motors’ performance under these conditions. This paper presents experimental data on the torque–speed relationship, efficiency, and thermal responses of one of the most widely used outrunner-type brushless motors across its full operating range, including high-power short-duration operation. The results of this study can inform the selection and design of actuators for a range of robotics applications, particularly those that require high power output for brief periods of time.
1. Introduction
Over the past decade, the multirotor drone market has seen substantial growth. This growth is largely due to the expanding use of drones in a variety of fields. Drones have become increasingly popular in photography and videography, where they provide unique perspectives and capabilities. They have also found a place in various industrial sectors such as agriculture, construction, and surveying [1], where they can perform tasks more efficiently and safely than traditional methods. This trend has led to significant advancements in motor technology, with a particular focus on the development of exterior-rotor brushless motors.
Exterior-rotor brushless motors offer a higher torque density compared to interior-rotor counterparts [2,3,4]. This characteristic makes them particularly suitable for robotics applications where design constraints include space and weight. For example, in the design of legged robots [5,6,7], the high torque density of these motors allows for more compact and efficient designs. Similarly, in the development of prostheses [8,9,10] and exoskeletons [11,12,13], these motors can provide the necessary power without adding excessive weight or bulk. Thus, the characteristics of these motors make them a suitable choice for a variety of applications, underscoring their importance in the field of robotics.
However, a significant challenge arises when attempting to fully leverage the potential of these motors. Drone motor manufacturers typically do not provide comprehensive performance data for these motors under varying conditions beyond drone-specific applications. This lack of data creates a knowledge gap, potentially limiting the effective utilization of these motors in diverse applications. A few research groups have sought to address this gap by investigating the performance of such motors across different applications [14,15]. While these studies have provided some insights into the performance characteristics of these motors, they also have their limitations. For instance, these studies did not involve direct electrical power measurements entering the motor, and they did not comprehensively explore high-power use cases.
In light of these limitations in the existing literature, our study aims to delve deeper into the performance characteristics of exterior-rotor brushless motors under a variety of operating conditions. We focus on the U8Lite KV100 motor, a model with specifications that have been used in various robotic applications [6,7,9,12,16,17]. Our evaluation includes direct measurements of electrical power input to both the drive and motor, as well as the mechanical power output from the motor shaft during high-power short-duration operation. In addition, we also monitor the motor’s thermal responses throughout the testing process. This comprehensive approach allows us to extend the scope of previous research by exploring the implications of high-power short-duration operation, a type of operation often required in robotics applications due to the periodic nature of the loads, such as those encountered during walking, running, or jumping.
Furthermore, our study aims to provide a more nuanced understanding of the potential risks and benefits of high-power short-duration operation. Manufacturers generally discourage overpowering the motors due to several potential issues, including the reduced efficiency and performance caused by torque saturation and permanent damage to the motors resulting from overheating and demagnetization. However, with careful temperature monitoring and proper thermal management, overpowering can be performed safely. By exploring these issues in depth, our study aims to provide a more comprehensive understanding of the performance characteristics of the U8Lite KV100 motor, which can inform the design of future robotic systems.
The findings from this comprehensive evaluation will contribute to the design of actuators in robotics applications, particularly those requiring high power output for brief durations. By addressing the current knowledge gap, we aim to enhance the understanding and utilization of this particular exterior-rotor brushless motor in various robotics applications. Ultimately, our study seeks to contribute to the ongoing efforts to optimize the performance and efficiency of robotic systems, providing valuable insights for the design of future robotic systems. By doing so, we hope to facilitate the development of more efficient, effective, and versatile robotic systems.
2. Materials and Methods
2.1. System Architecture
Figure 1 illustrates the system employed for testing. Figure 1a presents the overall schematic representation of the system, while Figure 1b depicts its physical embodiment. Two distinct tests were conducted using switching power supplies rated at 2500 W, operating under 24 V and 36 V (UHP-2500-24 and UHP-2500-36, MEAN WELL Enterprises Co., Ltd., New Taipei City, Taiwan). The selection of 24 V and 36 V was based on several considerations. Firstly, the voltages of 24 V and 36 V are frequently employed in mobile systems, making them readily available for purchase. While higher voltages might potentially enhance motor efficiency, the corresponding increase in the weight of the required battery pack does not sufficiently offset the relatively minor efficiency gains. Secondly, the ubiquity of these voltages in mobile systems simplifies the acquisition of compatible electronic components for power management. Essential components, including surge protection integrated circuits, diodes, and capacitors, are readily available within these voltage ranges, thereby facilitating the reliable operation of our system.
The drive system, EVEREST XCR-C motor driver (Novanta Inc., Bedford, MA, USA), has a power rating of 3000 W and is capable of supporting voltage inputs ranging from 8 to 80 V, with a continuous current of 45 A and a 3 s peak current of 60 A. The driver was tuned to drive the U8Lite KV100 (T-motor, Nanchang, Jiangxi, China) using a 100 kHz PWM switching frequency and a 50 kHz current control loop. The current control loop utilized an internal field-oriented control algorithm. The U8Lite KV100 motor is a delta-winding brushless motor with a weight of 238 g and 21 pole pairs. To facilitate feedback control, an absolute encoder (RM44, RLS Merilna tehnika d.o.o., Komenda, Slovenia) was installed at the back of the motor. In addition, a temperature sensor (NTC thermistor B57861S0103A039, TDK Electronics AG, Munich, Germany) was directly installed on the stator winding coil using a thermally conductive epoxy (EP42HT-2AO-1 Black, Master Bond Inc., Hackensack, NJ, USA) to measure the thermal response of the motor. For more accurate measurement, the thermistor was connected to a 2.5 kOhm reference resistor (USR2G-2K5X1, Riedon, Alhambra, CA, USA) to form a half bridge circuit. To maintain a consistent starting temperature of 25 °C and facilitate cooling, a fan was positioned adjacent to the motor. The fan operation was controlled based on readings from the temperature sensor.
To monitor the DC voltage and current entering the motor driver, a differential voltage divider (Entube DE, Verivolt, San Francisco, CA, USA) and a zero-flux current sensor (IsoBlock I-ZF, Verivolt, San Francisco, CA, USA) were used. The voltage sensor has a measuring range of ±100 V with an 85 kHz bandwidth and ±0.05% accuracy, while the current sensor has a measuring range of ±100 A with an 100 kHz bandwidth and ±0.02% accuracy. Both the voltage and current sensors produce an output of ±10 V, a value that aligns with the input requirements of a typical data acquisition (DAQ) device. To measure the line currents entering the motor, the same current sensors were utilized, while the line voltages were measured using a 3-channel differential voltage down-converter specifically designed for 3-phase systems (Entube TE, Verivolt, San Francisco, CA, USA). The Entube TE has the same measuring range, bandwidth, accuracy, and output as Entube DE. The output torque and speed of the motor were measured using a rotary torque sensor with integrated encoder (TRS705 FSH02564, Futek, Irvine, CA, USA). The torque sensor has a sensing range of ±5 Nm and a nonlinearity of ±0.2%. It was calibrated by the manufacturer prior to shipping. The driving motor (CPM-MCVC-D1003A-RLN, Teknics Industries, Inc., Lincoln Park, NJ, USA) is an integrated 3-phase servo motor that operates under 208 V AC and has a power rating of 4 hp (2982.8 W). It has a continuous torque of 13.4 Nm, a peak torque of 32.9 Nm, and a maximum speed of 2760 RPM.
Data from the voltage and current sensors were acquired using two analog input modules (NI 9215, Austin, TX, USA) at 40,000 samples/second, while the data from the thermistor were collected via a different analog input module (NI 9219, Austin, TX, USA) at 100 samples/second. This module has built-in voltage and current excitation and supports half-bridge inputs. A digital output module (NI 9401, Austin, TX, USA) was used to control the 3-phase servo motor. All these input and output modules were installed within a chassis (NI cDAQ-9178), which interfaced with a host computer via USB. Data from the torque sensor were collected at 100 samples/second and processed utilizing an separate DAQ system (USB 520, Futek, Irvine, CA, USA), which was also connected to the computer via USB. The configuration used for measuring both the electrical power and temperature is represented in Figure 2, which provides a detailed depiction of the setup, offering a close-up view that allows for a comprehensive understanding of the measurement apparatus.
2.2. Efficiency and Loss Mapping Procedure
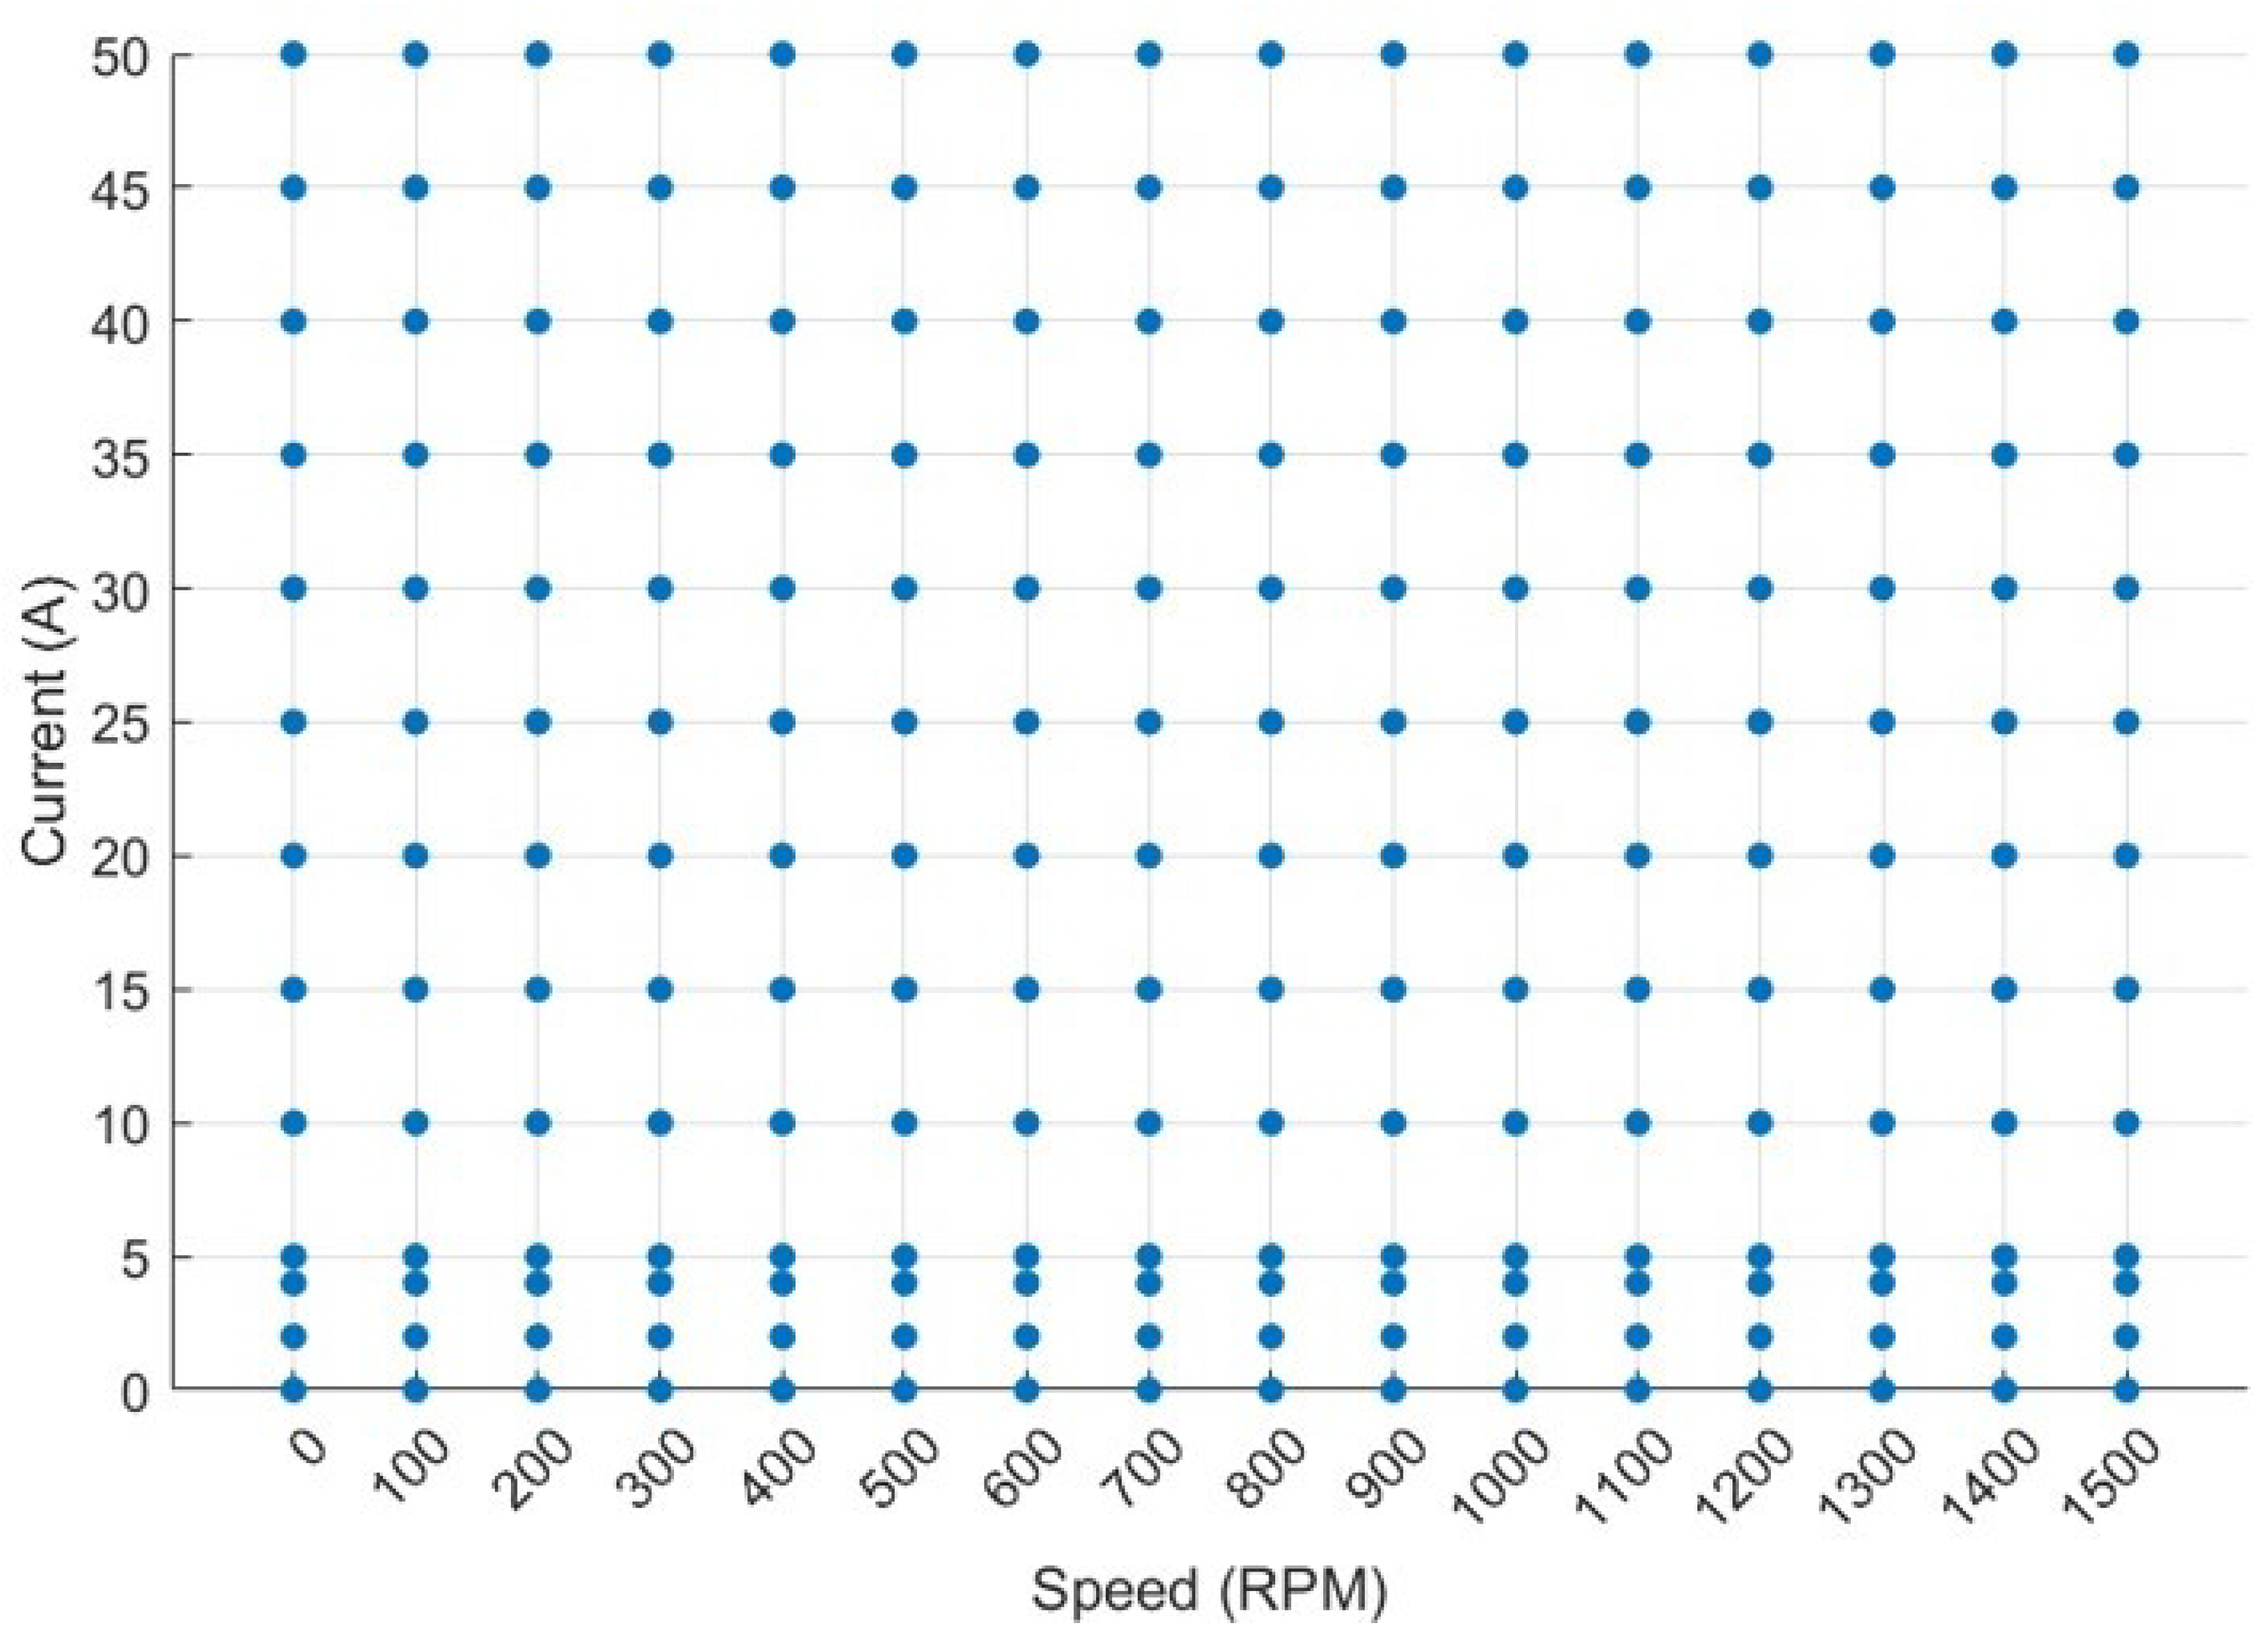
The experimental procedure involved a systematic exploration of the entire torque–speed plane through the establishment of a mesh of reference operating points, as illustrated in Figure 3. The figure represents the operating points utilized during testing under 24 V conditions. The speed range spanned from 0 to 1500 RPM (1700 RPM for the 36 V test) and was divided into equally spaced intervals of 100 RPM. This interval selection ensured an adequate resolution. Similarly, for each speed value, the torque, corresponding to the commanded current A, was adjusted from 0 to 50 A in increments of 5 A. These increments were also chosen to achieve an appropriate resolution. To further enhance the resolution, additional points of 2 A and 4 A were included for each speed value in both the 24 V and 36 V tests. Note that in this setup, the driving motor was regulated based on the speed and set the desired speed for a specific operating point. On the other hand, the U8Lite KV100 motor was current controlled. In brushed DC motors, higher current levels result in greater torque generation based on the relationship between motor torque constant, number of wire turns, magnetic flux strength, and current. Therefore, the operating points in Figure 3 with higher current setpoints correspond to a higher torque output.
For each operating point, the driving motor would first start for one second to ensure it reached the target speed, and then the U8Lite KV100 motor would begin applying torque. The tests were conducted for a duration of 3.5 s. After the 3.5 s interval, both motors were stopped, but the DAQ continued to collect temperature readings for an additional 15 s. Subsequently, the fan was activated to cool the motor until its temperature dropped below 25 °C before commencing the next operating point. During data processing, the initial and final 20% of the data were trimmed, and the remaining portion was utilized for the calculations. To calculate the motor’s input electrical power, the following equation was used:
where , , and represent the measured line currents, and , , and represent the measured line voltages. represents the phase difference between with respect to , represents the phase difference between with respect to , and represents the phase difference between with respect to . This equation is used to calculate the electrical power in unbalanced three-phase delta circuits with inductive or capacitive loads [18]. The DC power entering the drive was calculated using the following equation:
where and represent the root mean square (RMS) values of the DC voltage and current, respectively, coming out of the power supply. The RMS values of and were used due to the motor’s behavior at certain high-speed operating points. At these points, the motor essentially operates as a generator with negligible torque output, as opposed to its typical function as a torque generator. As a result, the AC currents were measured, necessitating the utilization of RMS values. The output mechanical power from the U8Lite KV100 motor was calculated as:
where is the measured torque, and the is the measured speed. Using these power values, the motor efficiency can be determined as follows:
Similarly, the motor driver efficiency can be calculated as:
Furthermore, the power loss of the motor can be determined by subtracting the output mechanical power from the input electrical power :
3. Results and Discussion
3.1. Motor Efficiency and Loss Maps
The procedure outlined above was executed using 24 V and 36 V power supplies. However, during the 36 V test, the motor could not complete the test at 1700 RPM with current setpoints of 45 A and 50 A due to the triggering of the protection. At these two operating points, the current controller would briefly overshoot beyond 60 A, which is the absolute maximum for the drive. While the motor managed to operate for 3 s at these operating points, it failed to maintain the necessary duration of 3.5 s, as prescribed by this study.
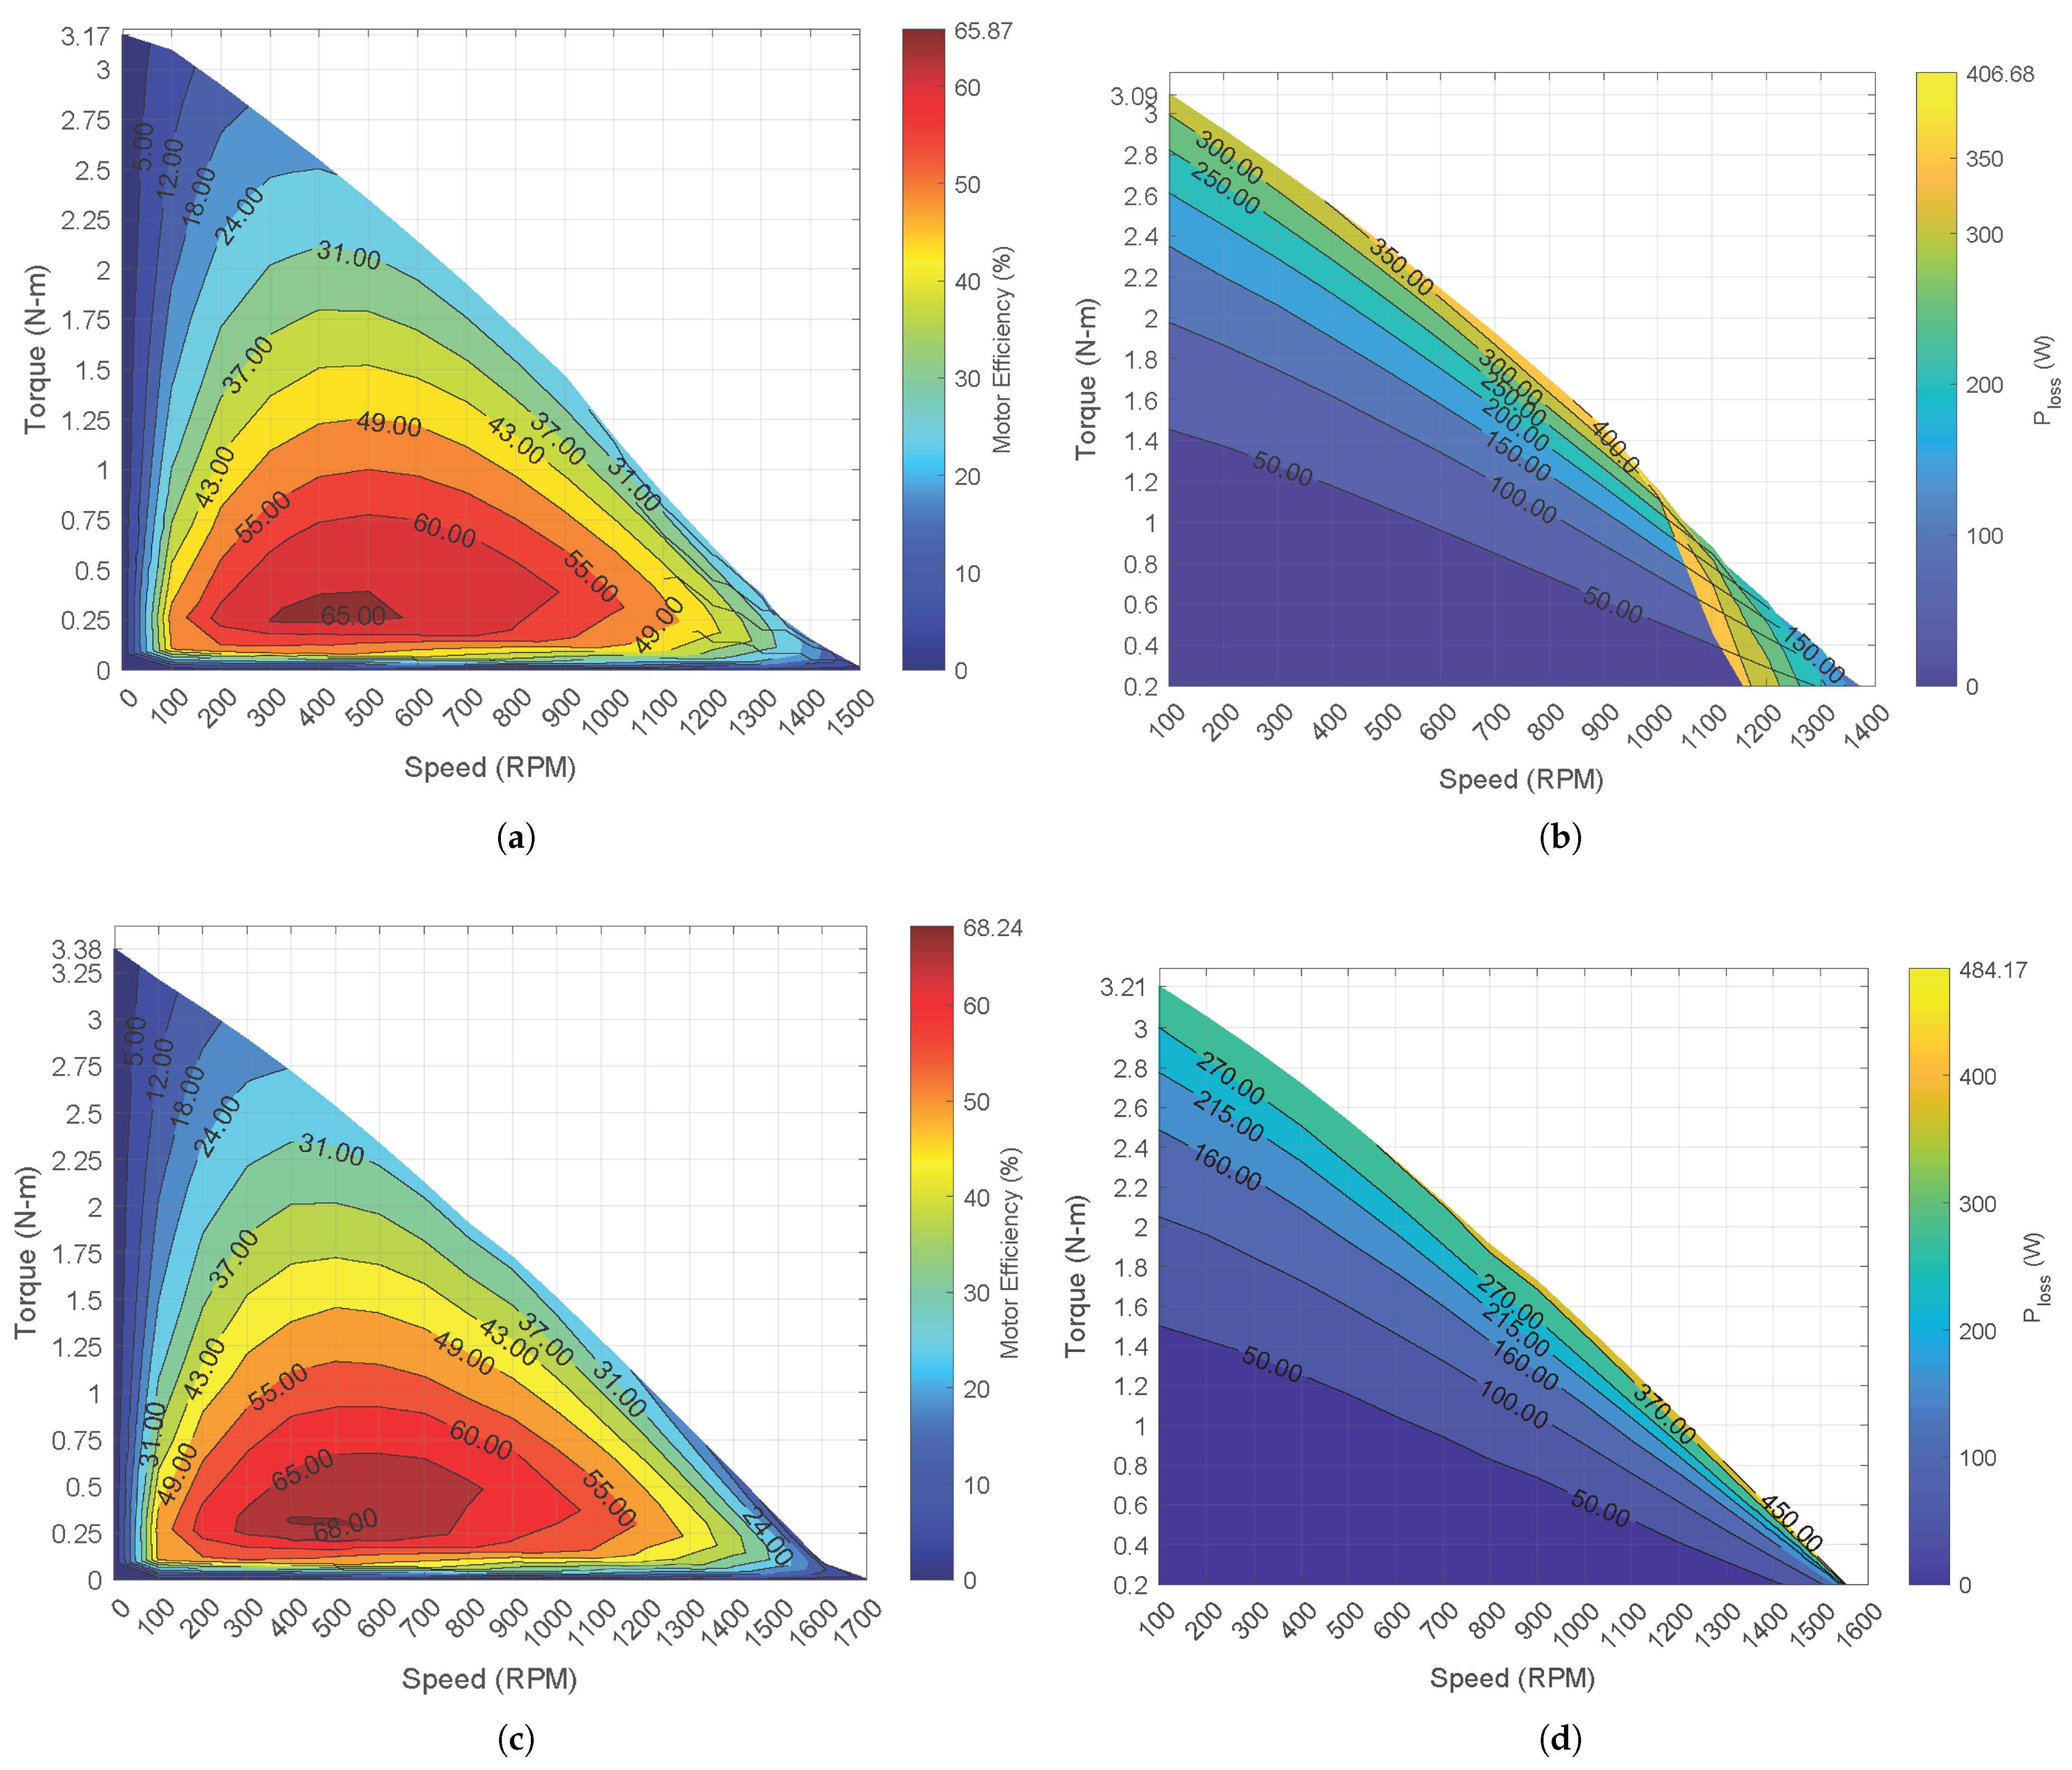
Figure 4 illustrates the motor efficiency and loss maps for the two voltage conditions. These maps play a crucial role in assessing the motor’s efficiency across the entire torque–speed range, providing insights into its performance characteristics. For instance, in mobile applications, operating the motor within the high-efficiency region is highly desirable to optimize battery usage. The efficiency maps visualize the ratio of the output mechanical power to the input electrical power across operating points. Higher efficiency areas indicate less electrical power is being dissipated as heat. From the results depicted in Figure 4, this region is observed to span speeds ranging from 200 RPM to 700 RPM, with torque values below 1 Nm. Furthermore, these efficiency maps can also provide information on how to momentarily exceed the motor’s power rating and ascertain the torque and speed limits that the motor can attain.
The loss maps provide information about the power dissipation in the motor at different operating points. However, it is important to note that the loss maps for the motor do not include the zero current and zero velocity operating points. These operating points were excluded because at zero speed, the motor does not produce any output mechanical power and, at zero current, the motor does not apply any torque. Therefore, including these points in the loss maps would not provide meaningful information about power dissipation. Nonetheless, the data from these points were included in the motor efficiency maps to provide a comprehensive view of the motor’s performance, including its maximum torque and speed capabilities. Further, under the 24 V condition, there are certain operating points, particularly at 1200 RPM and above, where the motor was unable to generate any positive torque. As a result, all the electrical power input was considered as loss, resulting in an irregular pattern in the loss map depicted in Figure 4b at high speeds.
From Figure 4, it is evident that operating the U8Lite KV100 motor at 36 V yielded improved performance compared to 24 V. When comparing the efficiency maps between the 24 V and 36 V conditions, it can be observed that the torque outputs were approximately 5% to 10% higher for speeds up to 600 RPM and 10% to 25% higher for speeds above 600 RPM. This indicates that the motor can generate higher levels of torque at higher operating voltages. Notably, under the 36 V condition, the motor exhibited the capability to generate torque even at higher speeds. Table 1 provides a more detailed comparison of the increase in torque generated by the motor at 36 V compared to 24 V. In addition to higher torque generation, the motor also exhibited higher efficiency under the 36 V condition. Furthermore, the area of the high-efficiency region was larger when operating the motor at 36 V.
3.2. Motor Driver Efficiency Maps
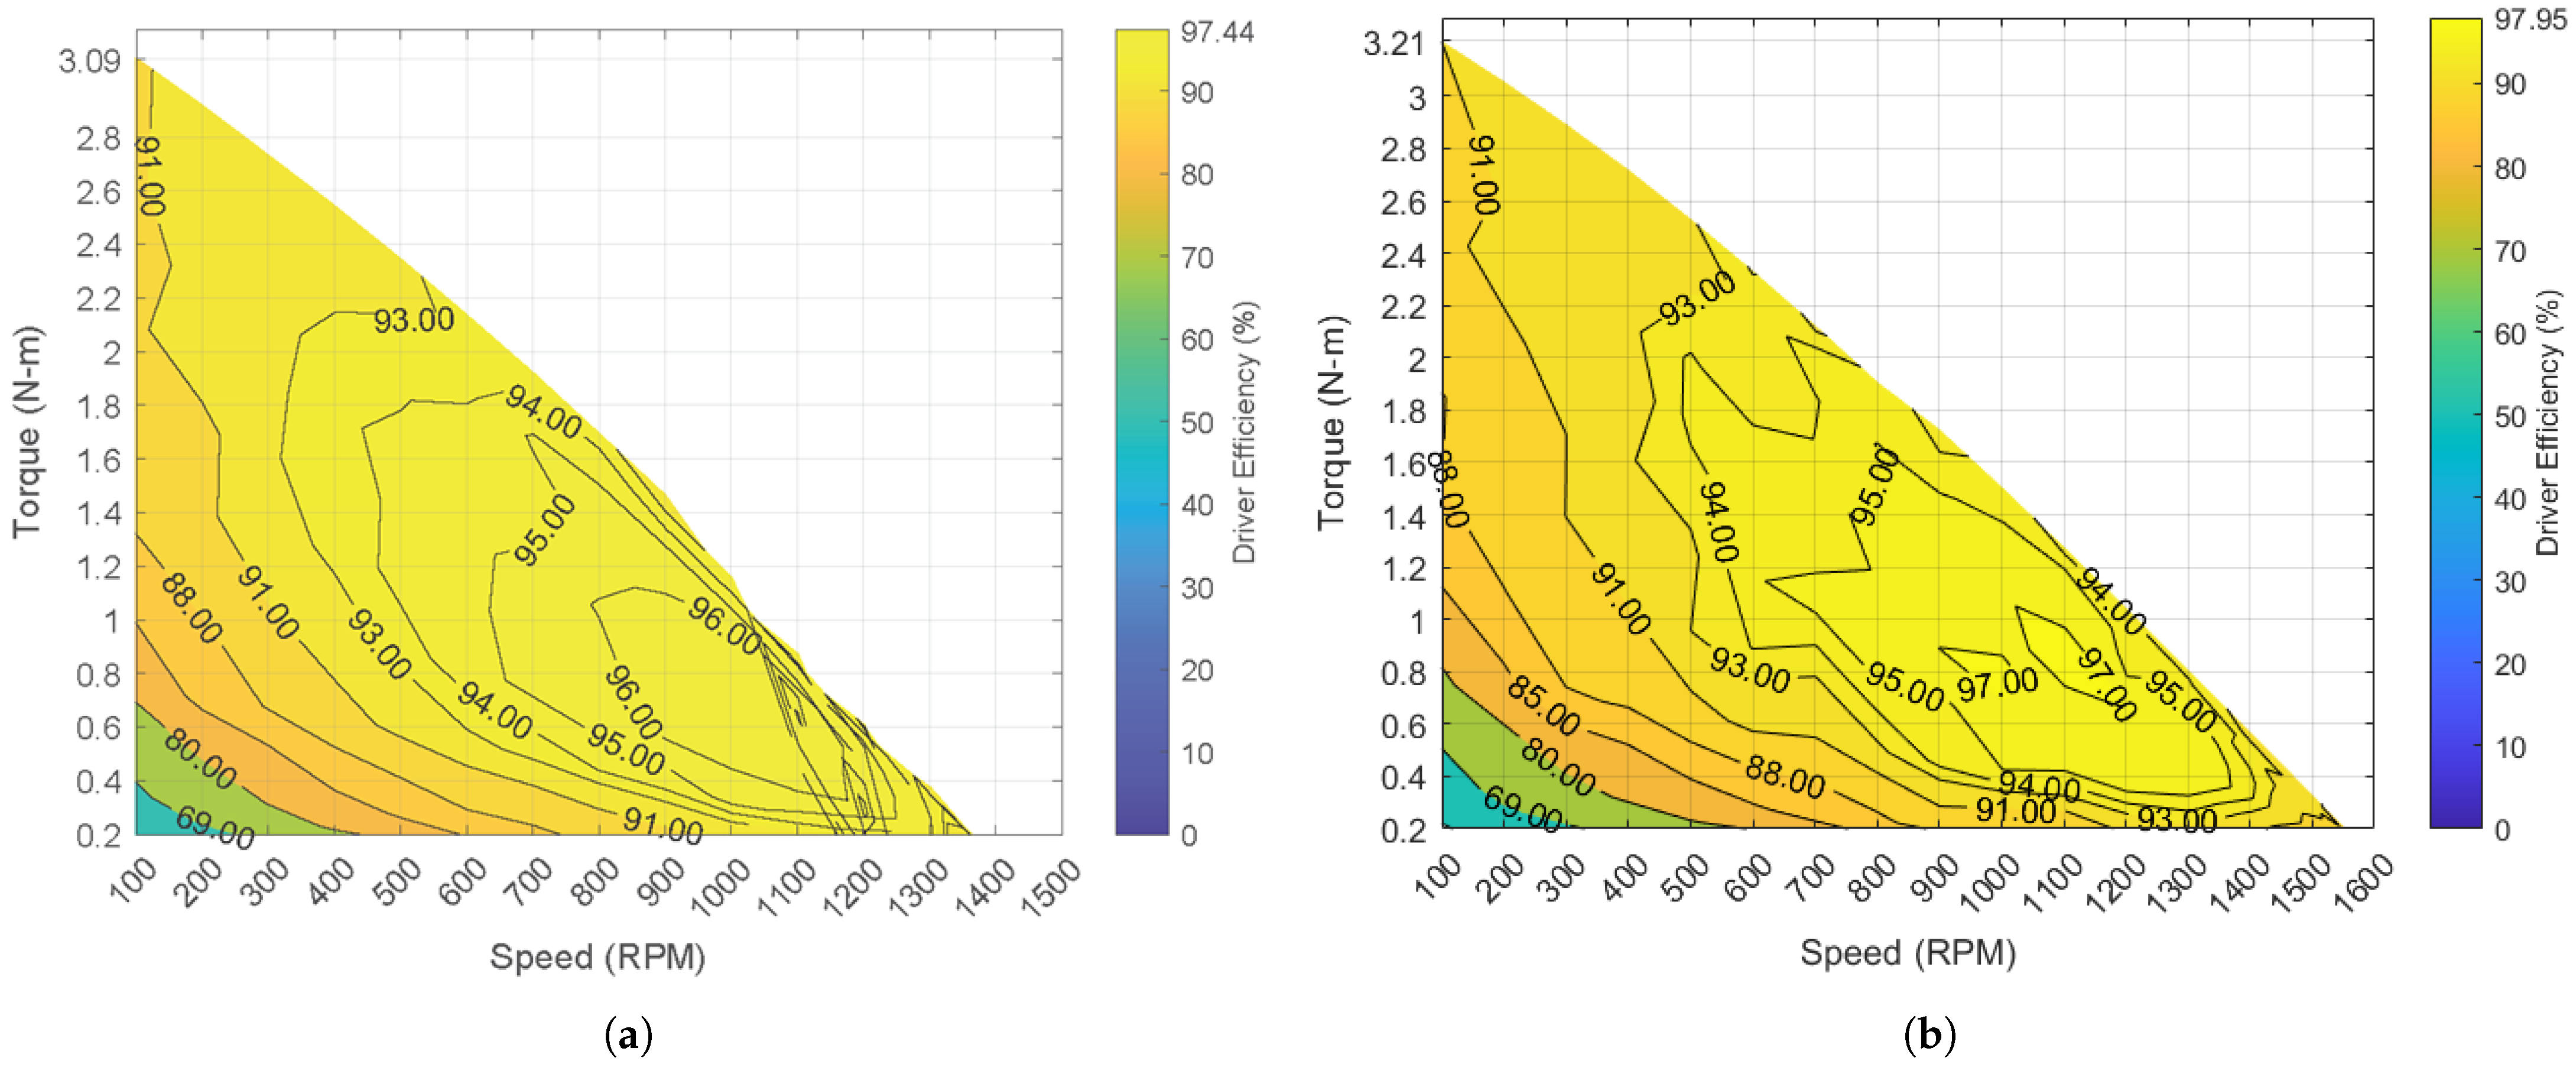
Because the primary focus of this study was to evaluate the motor’s performance, it was crucial to ensure that the motor driver did not impede the motor’s capabilities. To mitigate this, the driver was affixed to an aluminum plate, and a low-profile CPU cooler (C7 Cu, Cryorig, New Taipei City, Taiwan) was mounted on the plate. However, it is important to acknowledge that this thermal management solution may not be feasible for mobile applications due to weight and size considerations. Therefore, for mobile applications, it is recommended to conduct further tests to assess the thermal properties of the motor drive under various cooling methods. Figure 5 presents the efficiency maps for the EVEREST XCR-C motor driver at the two voltage conditions. The results obtained aligned with the energy efficiency specifications provided by the vendor [19]. The driver efficiency maps do not incorporate the zero current and zero velocity operating points for the same reason as the loss maps.
3.3. Motor Thermal Responses
Joule heating within the motor’s windings significantly impacts the motor’s performance. This thermal effect, caused by the resistance of the windings to the electric current, can lead to increased temperatures, potentially affecting the efficiency and longevity of the motor. Therefore, monitoring the temperature of the windings is crucial to ensure the motor is operated within safe limits when overpowering it. As mentioned earlier, during the tests at each operating point, the motor did not receive any active cooling and was only cooled after the test was completed. It is important to note that the motor should not exceed a temperature of 95 °C at any point during operation. Figure 6 illustrates the maximum temperature reached by the motor under both the 24 V and 36 V operating conditions.
These data provide assurance that briefly exceeding the motor’s power rating for a limited duration is acceptable within the specified thermal limits. Furthermore, Figure 7 displays the thermal responses of selected operating points, providing additional insights into the temperature behavior of the motor.
Upon comprehensive analysis of the thermal behavior, it becomes clear that the introduction of a higher voltage triggered a more accelerated rise in temperature, culminating in greater peak temperatures. Nonetheless, throughout the span of the 3.5 s test interval, this amplified temperature did not significantly affect the efficiency of the motor. Under the 36 V condition, the temperature peaked at approximately 57 °C when operating at high current setpoints, which remained comfortably below the specified limit of 95 °C.
In real-world applications where the motor might need to be momentarily overpowered, it is crucial to continuously monitor the temperature. The motor drive incorporates an protection system, which acts as a safety measure against situations where the instantaneous thermal energy surpasses a predetermined limit. This is vital as temperature sensors may not be quick enough to identify potentially hazardous conditions.
The instantaneous energy that the motor releases is directly proportional to the square of the current flowing through it and the time this current persists. The “nominal current” is defined as the maximum current that a motor can sustain continuously without breaching its thermal boundaries. Any current that goes beyond this nominal value results in an accumulation of thermal energy within the motor and its surroundings, which then needs to be dissipated by the cooling system.
If the thermal energy buildup exceeds the cooling system’s dissipation capacity, the system could reach its thermal limits, posing a risk of irreversible damage to the motor or the drive. The principle is associated with a value that is inversely proportional to the energy that the motor dissipates. The protection system serves as a control mechanism to ensure that the total power that the motor releases as thermal energy does not go beyond its thermal constraints. [20].
4. Conclusions
This study provides a comprehensive experimental analysis of the U8Lite KV100 motor under different operating conditions. The motor’s efficiency, power loss, driver efficiency, and thermal responses were thoroughly examined under two voltage conditions: 24 V and 36 V. The results reveal that the motor demonstrates enhanced performance when operated at 36 V, producing higher torque outputs and efficiency compared to the 24 V condition.
The unique contribution of this study lies in the rich dataset collected and the subsequent efficiency and loss maps generated. These maps offer a deeper understanding of the motor’s performance across the entire torque–speed range. This knowledge can be instrumental in optimizing battery usage in mobile robotic applications, thereby extending the operational time and enhancing the overall performance of robotic systems.
However, the practical application of these findings presents a complex challenge. A 36 V battery of the same capacity as a 24 V one would be larger and heavier. This may pose challenges for certain mobile robotic applications where size and weight are critical considerations. Although one could consider using a smaller capacity battery to mitigate these issues, the performance boost may not sufficiently compensate for the reduced capacity. Therefore, striking a careful balance between performance enhancement, battery capacity, and the physical constraints of the robotic application is essential for optimal results.
The thermal responses of the motor were also closely monitored, providing valuable insights into the motor’s ability to handle high-power operations. The results indicate that the motor can safely operate beyond its power rating for brief periods, provided the temperature does not exceed the specified limit of 95 °C. The introduction of a higher voltage resulted in a more accelerated rise in temperature, but this did not significantly affect the motor’s efficiency during the test interval.
The study also underscored the importance of the protection scheme integrated into the motor drive. This mechanism, which prevents the motor or the drive from potential damage due to excessive thermal energy, is a critical consideration in the design of reliable and safe robotic systems.
In light of these findings, it is recommended that further tests be conducted to assess the thermal properties of the motor drive under various cooling methods. This is particularly important for mobile robotics applications where weight and size considerations may limit the feasibility of certain thermal management solutions. Such research could further inform the design and selection of actuators for robotics, contributing to the development of more efficient, reliable, and safe robotic systems. This study, therefore, serves as a stepping stone towards a more nuanced understanding of motor performance in robotics, paving the way for future research in this critical area of robotics engineering.
Author Contributions
Conceptualization, T.-H.H. and H.H.; methodology, T.-H.H., S.H.Y. and H.H.; software, T.-H.H.; validation, T.-H.H.; formal analysis, T.-H.H.; data curation, T.-H.H.; writing—original draft preparation, T.-H.H.; writing—review and editing, T.-H.H. and H.H.; visualization, T.-H.H.; supervision, H.H.; project administration, H.H.; funding acquisition, H.H. All authors have read and agreed to the published version of the manuscript.
Funding
This research was funded by The MIT K. Lisa Yang Center for Bionics and MIT Media Lab Consortia.
Data Availability Statement
The data presented in this study are openly available in GitHub at https://github.com/thhsieh/U8-Kv100-Dyno-Data.
Conflicts of Interest
The authors declare no conflict of interest.
Abbreviations
The following abbreviations are used in this manuscript:
| MDPI | Multidisciplinary Digital Publishing Institute |
| DOAJ | Directory of Open Access Journals |
References
- Multirotor Drone Market—Report Overview. Available online: https://www.alliedmarketresearch.com/multirotor-drone-market-A09185 (accessed on 18 April 2023).
- Kenneally, G.; De, A.; Koditschek, D.E. Design principles for a family of direct-drive legged robots. IEEE Robot. Autom. Lett. 2016, 1, 900–907. [Google Scholar] [CrossRef] [Green Version]
- Reichert, T.; Nussbaumer, T.; Kolar, J.W. Torque scaling laws for interior and exterior rotor permanent magnet machines. IEEE Int. Magn. Conf. 2009, 3, 4–7. [Google Scholar]
- Lee, J.J.; Kim, W.H.; Yu, J.S.; Yun, S.Y.; Kim, S.M.; Lee, J.J.; Lee, J. Comparison between concentrated and distributed winding in IPMSM for traction application. In Proceedings of the IEEE International Conference on Electrical Machines and Systems, Incheon, Republic of Korea, 10–13 October 2010; pp. 1172–1174. [Google Scholar]
- Brill, A.L.; De, A.; Johnson, A.M.; Koditschek, D.E. Tail-assisted rigid and compliant legged leaping. In Proceedings of the 2015 IEEE/RSJ International Conference on Intelligent Robots and Systems, Hamburg, Germany, 28 September 2015–2 October 2015; pp. 6304–6311. [Google Scholar]
- Katz, B.; Carlo, J.D.; Kim, S. Mini cheetah: A platform for pushing the limits of dynamic quadruped control. In Proceedings of the 2019 International Conference on Robotics and Automation (ICRA), Montreal, QC, Canada, 20–24 May 2019; pp. 6295–6301. [Google Scholar]
- Kalouche, S. GOAT: A legged robot with 3D agility and virtual compliance. In Proceedings of the 2017 IEEE/RSJ International Conference on Intelligent Robots and Systems (IROS), Vancouver, BC, Canada, 24–28 September 2017; pp. 4110–4117. [Google Scholar]
- Carney, M.E.; Shu, T.; Stolyarov, R.; Duval, J.-F.; Herr, H.M. Design and Preliminary Results of a Reaction Force Series Elastic Actuator for Bionic Knee and Ankle Prostheses. IEEE Trans. Med. Robot. Bionics 2021, 3, 542–553. [Google Scholar] [CrossRef]
- Azocar, A.F.; Mooney, L.M.; Duval, J.F.; Simon, A.M.; Hargrove, L.J.; Rouse, E.J. Design and clinical implementation of an open-source bionic leg. Nat. Biomed. Eng. 2020, 4, 941–953. [Google Scholar] [CrossRef] [PubMed]
- Zhu, J.; Jiao, C.; Dominguez, I.; Yu, S.; Su, H. Design and Backdrivability Modeling of a Portable High Torque Robotic Knee Prosthesis With Intrinsic Compliance for Agile Activities. IEEE/ASME Trans. Mechatron. 2022, 27, 1837–1845. [Google Scholar] [CrossRef] [PubMed]
- Yu, S.; Huang, T.-H.; Yang, X.; Jiao, C.; Yang, J.; Chen, Y.; Yi, J.; Su, H. Quasi-Direct Drive Actuation for a Lightweight Hip Exoskeleton With High Backdrivability and High Bandwidth. IEEE/ASME Trans. Mechatron. 2020, 25, 1794–1802. [Google Scholar] [CrossRef] [PubMed]
- Nesler, C.; Thomas, G.; Divekar, N.; Rouse, E.J.; Gregg, R.D. Enhancing Voluntary Motion With Modular, Backdrivable, Powered Hip and Knee Orthoses. IEEE Robot. Autom. Lett. 2022, 7, 6155–6162. [Google Scholar] [CrossRef] [PubMed]
- Huang, T.-H.; Zhang, S.; Yu, S.; MacLean, M.K.; Zhu, J.; Di Lallo, A.; Jiao, C.; Bulea, T.C.; Zheng, M.; Su, H. Modeling and Stiffness-Based Continuous Torque Control of Lightweight Quasi-Direct-Drive Knee Exoskeletons for Versatile Walking Assistance. IEEE Trans. Robot. 2022, 38, 1442–1459. [Google Scholar] [CrossRef] [PubMed]
- Lee, U.H.; Pan, C.-W.; Rouse, E.J. Empirical Characterization of a High-performance Exterior-rotor Type Brushless DC Motor and Drive. In Proceedings of the 2019 IEEE/RSJ International Conference on Intelligent Robots and Systems (IROS), Macau, China, 4–8 November 2019; pp. 8018–8025. [Google Scholar]
- Katz, G.B. A Low Cost Modular Actuator for Dynamic Robots. Master’s Thesis, Massachusetts Institute of Technology, Cambridge, MA, USA, 2018. [Google Scholar]
- Hsieh, T.H. Design and Control of a Two-Degree-of-Freedom Powered Ankle-Foot Prosthesis. Master’s Thesis, Massachusetts Institute of Technology, Cambridge, MA, USA, 2019. [Google Scholar]
- Kang, I.; Peterson, R.R.; Herrin, K.R.; Mazumdar, A.; Young, A.J. Design and Validation of a Torque-Controllable Series Elastic Actuator-Based Hip Exoskeleton for Dynamic Locomotion. J. Mech. Robot. 2023, 15, 021007. [Google Scholar] [CrossRef]
- Fleckenstein, J.E. Three-Phase Electrical Power, 1st ed.; CRC Press: Boca Raton, FL, USA, 2016; pp. 182–184. [Google Scholar]
- Everest XCR Product Description. Available online: https://drives.novantamotion.com/eve-xcr/product-description (accessed on 8 February 2023).
- Drive Protections. Available online: https://drives.novantamotion.com/denxcr/drive-protections (accessed on 18 May 2023).
Figure 1.
Overview of the experimental apparatus designed for the in-depth characterization of the motor and drive. (a) Diagram representing the key components. (b) Physical realization of the system.
Figure 1.
Overview of the experimental apparatus designed for the in-depth characterization of the motor and drive. (a) Diagram representing the key components. (b) Physical realization of the system.

Figure 2.
Close-up views of key components: (a) current and voltage sensors, (b) rear view of the sensors and the DAQ system, (c) direct installation of a thermistor on the stator coil, and (d) placement of a fan adjacent to the motor for cooling.
Figure 2.
Close-up views of key components: (a) current and voltage sensors, (b) rear view of the sensors and the DAQ system, (c) direct installation of a thermistor on the stator coil, and (d) placement of a fan adjacent to the motor for cooling.

Figure 3.
Operating points utilized during testing under the 24 V condition. The plot showcases the specific combination of speed and torque values spanning the entire torque–speed plane. For the 36 V condition, the operating points follow the same pattern, with additional speeds of 1600 RPM and 1700 RPM.

Figure 4.
The efficiency and loss maps of the U8Lite KV100 motor. (a) Efficiency map for 24 V. (b) Loss map for 24 V. (c) Efficiency map for 36 V. (d) Loss map for 36 V.
Figure 4.
The efficiency and loss maps of the U8Lite KV100 motor. (a) Efficiency map for 24 V. (b) Loss map for 24 V. (c) Efficiency map for 36 V. (d) Loss map for 36 V.

Figure 5.
The efficiency maps of the EVEREST XCR−C motor driver at (a) 24 V and (b) 36 V.

Figure 6.
(a) Maximum temperature at each operating point for 24 V. (b) Maximum temperature at each operating point for 36 V. Please note that temperature data for the 45 A and 50 A current setpoints at 1700 RPM were not collected due to the activation of the protection.
Figure 6.
(a) Maximum temperature at each operating point for 24 V. (b) Maximum temperature at each operating point for 36 V. Please note that temperature data for the 45 A and 50 A current setpoints at 1700 RPM were not collected due to the activation of the protection.

Figure 7.
Thermal responses of the motor. (a) Thermal responses for selected operating points under 24 V. (b) Thermal responses for selected operating points under 36 V. The accelerated heating with higher current aligns with the greater resistive power dissipation predicted by Joule’s first law.
Figure 7.
Thermal responses of the motor. (a) Thermal responses for selected operating points under 24 V. (b) Thermal responses for selected operating points under 36 V. The accelerated heating with higher current aligns with the greater resistive power dissipation predicted by Joule’s first law.


Table 1.
Percentage increase in torque at selected operating points, comparing 36 V to 24 V.
| 200 RPM | 400 RPM | 600 RPM | 800 RPM | 1000 RPM | |
|---|---|---|---|---|---|
| 2 A | 5.11% | 9.68% | 15.5% | 25.11% | 67.98% |
| 4 A | 3.73% | 6.69% | 10.36% | 14.92% | 29.03% |
| 5 A | 4.34% | 6.79% | 10.79% | 16.34% | 29.81% |
| 10 A | 3.86% | 6.01% | 9.22% | 13.6% | 24.05% |
| 15 A | 3.79% | 6.06% | 9.06% | 12.91% | 23.08% |
| 20 A | 3.95% | 6.1% | 8.94% | 12.83% | 23.02% |
| 25 A | 4.15% | 6.33% | 9.00% | 12.86% | 22.81% |
| 30 A | 4.45% | 6.5% | 9.2% | 12.79% | 22.78% |
| 35 A | 4.59% | 6.68% | 9.32% | 12.76% | 22.79% |
| 40 A | 4.74% | 6.78% | 9.32% | 12.68% | 22.65% |
| 45 A | 4.79% | 6.83% | 9.28% | 12.71% | 22.44% |
| 50 A | 4.72% | 6.87% | 9.12% | 12.53% | 34.47% |
Disclaimer/Publisher’s Note: The statements, opinions and data contained in all publications are solely those of the individual author(s) and contributor(s) and not of MDPI and/or the editor(s). MDPI and/or the editor(s) disclaim responsibility for any injury to people or property resulting from any ideas, methods, instructions or products referred to in the content. |
© 2023 by the authors. Licensee MDPI, Basel, Switzerland. This article is an open access article distributed under the terms and conditions of the Creative Commons Attribution (CC BY) license (https://creativecommons.org/licenses/by/4.0/).
Share and Cite
MDPI and ACS Style
Hsieh, T.-H.; Yeon, S.H.; Herr, H. Energy Efficiency and Performance Evaluation of an Exterior-Rotor Brushless DC Motor and Drive System across the Full Operating Range. Actuators 2023, 12, 318. https://doi.org/10.3390/act12080318
AMA Style
Hsieh T-H, Yeon SH, Herr H. Energy Efficiency and Performance Evaluation of an Exterior-Rotor Brushless DC Motor and Drive System across the Full Operating Range. Actuators. 2023; 12(8):318. https://doi.org/10.3390/act12080318
Chicago/Turabian StyleHsieh, Tsung-Han, Seong Ho Yeon, and Hugh Herr. 2023. "Energy Efficiency and Performance Evaluation of an Exterior-Rotor Brushless DC Motor and Drive System across the Full Operating Range" Actuators 12, no. 8: 318. https://doi.org/10.3390/act12080318
Note that from the first issue of 2016, this journal uses article numbers instead of page numbers. See further details here.